-
Posts
15023 -
Joined
-
Days Won
8
Content Type
Profiles
Forums
Store
Downloads
Recruiting - 2020
2019-2020 Football Season
Football
Entertainment
Sports
News and Business
Cloak Room
Transfer Portal
Recruiting
Events
Everything posted by bolverk
-
-

Papers, please. Surly thread of deportation cruelty dominance
bolverk replied to Captainant's topic in Daily Texan
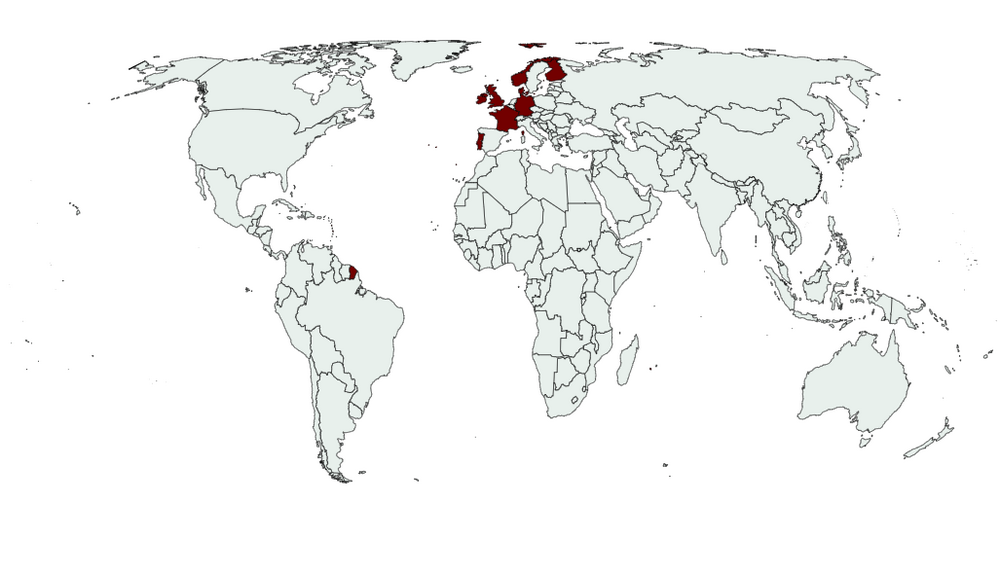
Countries That Have Issued U.S. Travel Warnings https://www.newsweek.com/portugal-issues-travel-warning-us-2051891 -
My gawd, get out.
-
Username checks the fuck out. I was just looking at photos/videos. Terrible shit. Edit: Godspeed, bro. I hope you don't lose your home -- really sorry this happened. I'd be freaked out right now if I were in your shoes.
-
My guess is he's just persecuting them for their religion. "SHARIA LAW!!!" Gov. Abbott announces third investigation into East Plano Islamic Center, citing 'potential' fraud A third investigation into the East Plano Islamic Center is underway, with claims from Gov. Greg Abbott the group could be misleading investors who've purchased land in an upcoming project — though the governor did not provide details as to how. The Texas State Securities Board is conducting an investigation for "potential failures to comply with applicable state and federal securities requirements," including protections against fraud, Abbott said Thursday. “The group behind the proposed East Plano Islamic Center compound may be misleading investors,” Abbott said in the press release. “Defrauding Texans will not be tolerated. The Texas State Securities Board is conducting a thorough investigation to ensure Texans are protected from financial harm that is alleged to have been caused by EPIC." Abbott did not give further details as to what state and federal securities requirements may have been violated and has not responded to repeated requests for comment about EPIC in recent days. Thursday's announcement comes after two separate investigations launched this week prompted by the governor and Attorney General Ken Paxton against the mosque and its project "EPIC City." The development would be located in Josephine, a city about 40 miles northeast of Dallas. It includes a new mosque, more than 1,000 single and multi-family homes, a K-12 faith-based school, senior housing, an outreach center, commercial developments, sports facilities, and a community college. Abbott has repeatedly accused the mosque without evidence of promoting "Sharia law" — referring to a body of religious laws forming part of the Islamic traditions, which itself has been the target of conservative legislators across the country. KERA News reached out to the East Plano Islamic Center for a comment and will update this story with any response.
-
Wordle 1,378 4/6 🟨⬛⬛⬛🟩 ⬛⬛⬛🟩🟩 ⬛⬛🟩🟩🟩 🟩🟩🟩🟩🟩 Connections Puzzle #656 🟨🟨🟨🟨 🟩🟩🟩🟩 🟦🟦🟦🟦 🟪🟪🟪🟪 🙂 Daily Quordle 1159 7️⃣6️⃣ 4️⃣5️⃣ m-w.com/games/quordle/ 🟨🟨⬜⬜🟨 🟨⬜⬜⬜⬜ ⬜⬜⬜⬜🟩 ⬜⬜⬜⬜⬜ ⬜⬜⬜⬜⬜ ⬜🟩🟨⬜🟩 ⬜🟨⬜⬜🟩 ⬜⬜⬜⬜⬜ ⬜🟨⬜⬜⬜ ⬜⬜⬜⬜⬜ ⬜⬜🟨⬜⬜ 🟩🟩🟩🟩🟩 🟩🟩🟩🟩🟩 ⬛⬛⬛⬛⬛ ⬜⬜⬜⬜🟨 ⬜⬜⬜⬜🟨 ⬜⬜🟩⬜🟩 ⬜⬜🟩🟩⬜ ⬜⬜⬜🟨⬜ 🟨⬜⬜⬜⬜ 🟩🟩🟩🟩🟩 ⬜🟩🟩⬜⬜ ⬛⬛⬛⬛⬛ 🟩🟩🟩🟩🟩
-
https://www.politico.com/story/2017/05/19/paul-ryan-reacts-kevin-mccarthy-recording-238602
-
Since my high school years, I've seen the shitty consequences of: A stupid War on Gays. The older boyfriend of a good gay friend of mine commit suicide by pointing a pistol at his chest and firing, rather than have to face AIDS, while Good Ol' Ronnie pretended the AIDS quilt wasn't spread across the National Mall. A stupid fucking War on Drugs. A stupid fucking War on Welfare Queens. A stupid fucking War on Terror. Stupid fucking invasions to further our addiction to Middle Eastern oil. Stupid fucking support for a small Apartheid nation-state oppress an entire people based solely on Biblical passages from 2,000 years ago. Stupid fucking denial of Global Warming. Stupid fucking tax cuts for billionaires. Stupid fucking attack on people coming to this country to better their lives. Stupid fucking court rulings allowing billionaires to buy our government. Now, we get to see the stupid fucking consequences of putting a torch to everything. Do you want me to go on? Everything I've seen since I started paying to all this shit around 1990 has been a prolonged four-decade mental health crisis among conservatives.
- 1337 replies
-
- 13
-

-

-
I've been pissed about the state of things for 35 years, watching one of the two major parties slowly, but inevitably, fall into a party of hate and self-destruction.
-
I'm not going to deny that we're all pissed. Why aren't you?
-
@Anastasis You're quickly losing some of the goodwill you earned when you personally reached out to offer comfort, understanding, and knowledge as my dad lay dying of Covid in a small-town hospital while my PA sister, who dropped everything at her practice in Denver, was desperately trying different means of treatment for my mom's recovery at home, who was also in a bad way with Covid while my sister was living in my parents' RV next to the house for a month, putting on her special hospital spacesuit each time she entered the house. In that moment, you patiently explained what you thought was best at that time, which I continue to greatly appreciate to this day. Back then, you showed empathy, kindness, and humanity. The stuff you're saying right now is just fucking callous, ignoring all the deleterious effects that are ruining the lives of hundreds of thousands of people, both here in the US and abroad. At the time, a little over four years ago, you flipped a switch for a little while, turning on your education and training, but now, you've turned that switch off and let your individual ideology overtake the humanity you once showed me. I know you still have that setting switched on when you correctly criticize what the Israelis were (are) doing to the Palestinians. That empathy stuff is a good thing. It shows you're not a sociopath...unless you're really good at faking it and have totally fooled me. It's okay that we all don't believe the exact same stuff, and I'm going to still disagree with a lot of shit you say, but what's most bothersome is the touch of malignant glee that lingers around some of your latest posts. I mean, you came across as a burn-it-all-down guy for a while during the first four years of this jackass, but I think you actually kind of mean this shit now, disregarding any internal emotional guardrails you'd developed to cope in life to get along. You're genuinely coming across as a belligerent -- someone who seeks joy from the suffering of others. And what makes this all the worse is that you're digging in on your habit of just not communicating in a straightforward way, as if you want to make people divine your intent. I just have got to say, that shit is some veritably manipulative behavior. You're not the Oracle of Delphi. Why can't you be a normal guy again, identifying specific problems you see, exploring ideas, explaining your viewpoint, not being cagey, and offering up what you think are good solutions to your grievances without causing harm to other humans? None of the above is meant as an insult; I'd just like to fucking understand.
-
We've all been asking ourselves that for almost 10 years now.
-

The Leopards Eating Faces and Unlubed Dildo of Consequences Thread
bolverk replied to Horn Dog's topic in Cloak Room
I don't really know much about the industry, but according to this piece, about a quarter of their parts/components are imported, so they will see some effect. https://www.surlyhorns.com/board/topic/40328-non-political-tariffs-thread/page/9/#comment-6970790 From here, I saw an estimate that tariffs could increase the cost of an EV by about $12,000. https://www.npr.org/2025/03/27/nx-s1-5342456/tariffs-tesla-imports-musk-trump -

The poster formerly known as ztejas (update)
bolverk replied to ztejas's topic in Please do this better?
Interesting about the TCU news. So, I'm in my early 50s and adopted. I met my birthmother in 1998 (we remain close) while I was getting my Masters at UT. I never met my birthfather in person (RIP - he passed this past summer), but we spoke on the phone once about 15 years ago. He had two other sons from a different mother, both much younger. The older one attended Rice, while the other went to TCU. The latter was apparently on one of their athletic teams and got caught up in all of that and got busted. I'd first heard about all the brouhaha on Shaggy when it happened, but I had no idea one of my half-brothers was involved when the news broke. I learned about that a few years later, I think from my birthmom. Anyway, I eventually did find his name in an old newspaper article about it and what the charges were, with distribution being one of them, but I don't recall what the drug was or if it was mentioned. When I spoke to my birthfather, he hadn't told a soul to anyone in his life that I existed so I gave him his privacy. I've never been in contact with either half-brother, so I don't know the TCU one's side of the story. All I can say is that it looks like charges were dropped against him for whatever reason. I'm pretty sure my birthfather was rich, living in a big house in River Oaks and having inherited an independent oil company from his father, so I don't know what deals may have gone on to get my half-brother out of that mess. By all appearances from what I can tell from what's publicly available on his FB page, the younger half-brother got off scot-free (I think). No idea about his recovery or rehab. It'd be wild if you knew him. Anyway, I'll just hum a couple of bars of "it's a small world after all" and wish you the best. Keep rockin', good man. Best to you, too, ztejas. -
Unfortunately, they missed changing the stripes to make a Russian flag.
-
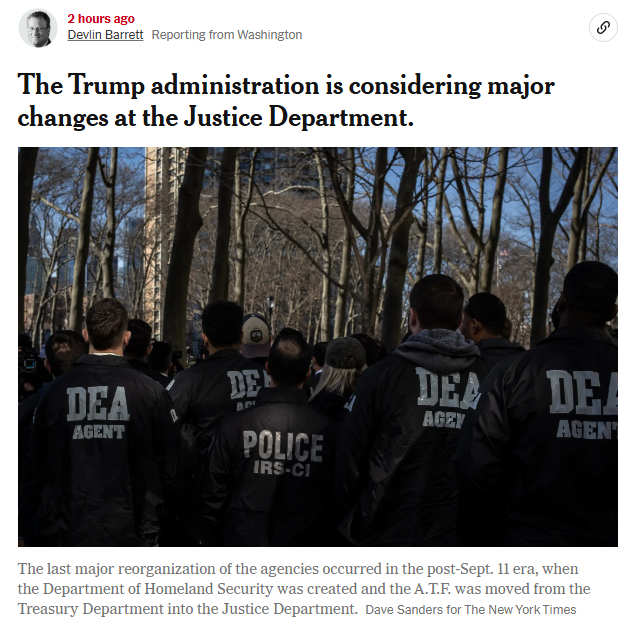
That second of the two that I bolded is the one that stood out to me as causing more potential harm. The DEA/ATF merger is what's going to get the headlines though, but I don't have much to criticize about that other than what you've stated.
-
How Major Car Brands Are Affected by Trump’s Tariffs The scale of the damage depends on the circumstances of each company’s supply chain. The tariffs on cars and auto parts that President Trump announced on Wednesday will have far-reaching effects on automakers in the United States and abroad. But there will be important differences based on the circumstances of each company. Tesla The company run by Mr. Trump’s confidant, Elon Musk, makes the cars it sells in the United States in factories in California and Texas. As a result, it is perhaps the least exposed to tariffs. But the company does buy parts from other countries — about a quarter of the components by value in its cars come from abroad, according to the National Highway Traffic Safety Administration. In addition, Tesla is struggling with falling sales around the world, in part because Mr. Musk’s political activities and statements have turned off moderate and liberal car buyers. Some countries could seek to retaliate against Mr. Trump’s tariffs by targeting Tesla. A few Canadian provinces have already stopped offering incentives for purchases of Tesla’s electric vehicles. General Motors The largest U.S. automaker imports many of its best selling and most profitable cars and trucks, especially from Mexico, where it has several large factories that churn out models like the Chevrolet Silverado. Roughly 40 percent of G.M.’s sales in the United States last year were vehicles assembled abroad. This could make the company vulnerable to the tariffs. But unlike some other automakers, G.M. has posted strong profits in recent years and is considered by analysts to be on good financial footing. That could help it weather the tariffs better than other companies, especially if the import taxes are removed or diluted by Mr. Trump. Ford Motor Ford is much less reliant on imported cars than many of its rivals. It makes about 80 percent of the vehicles it sells in the United States in the country. As a result, it would be relatively insulated from the 25 percent tariffs on imported vehicles. But the company is still dependent on foreign factories for major parts like engines. A Ford factory in Ontario, for example, makes engines for some of its pickup trucks. Ford has been losing billions of dollars on electric vehicles. One of its three battery-powered models, the Mustang Mach-E, is produced at a factory near Mexico City. Stellantis The company that owns Chrysler, Dodge, Jeep and Ram, uses overseas factories, in Mexico in particular, to assemble some popular models like Ram pickup trucks. Another model, the Chrysler Pacifica minivan, is made in Ontario. Stellantis, which was created by the 2021 merger of Fiat Chrysler and Peugeot, has also been struggling with sluggish sales and is searching for a new chief executive. Those challenges put the company, along with some others like Nissan, at greater risk, especially if the tariffs stay in place for months or years. Toyota Like other Japanese automakers, Toyota is very dependent on the United States and sold 2.3 million cars in the country last year. About one million of those vehicles were made in other countries, many of them in Canada, Mexico and Japan. That could be a big problem for the company and automakers like Subaru and Mazda, with which Toyota works closely. But Toyota, the world’s largest automaker, is in a better position than other automakers. It is profitable and considered by analysts to be one of the best-run companies in the global auto industry. Volkswagen Europe’s largest automaker could be really hurt by tariffs because it has just one factory in the United States, in Chattanooga, Tenn., where it makes the Atlas and ID.4 sport utility vehicles. It imports many of its cars, including Audis and Volkswagens from Mexico and Porsches from Germany. The company has struggled financially in recent years because its sales have fallen sharply in China, where domestic automakers have grown quickly by introducing lots of affordable electric and hybrid vehicles. Volkswagen had hoped to make inroads in the United States, but Mr. Trump’s latest tariffs could make that difficult task even harder. Hyundai and Kia The South Korean stablemates have made impressive sales gains in the United States in recent years. The companies have also invested in a new electric vehicle factory in Georgia that is starting to increase production, which could help them avoid tariffs on some models. On Monday, Hyundai’s executive chair, Euisun Chung, announced at the White House with Mr. Trump that his company would invest another $21 billion in the United States, including in a new steel factory in Louisiana. Even though Hyundai and Kia now have three factories in Georgia and Alabama, they will not be able to avoid tariffs on the hundreds of thousands of cars they import into the United States. Many of those vehicles came from South Korea, which negotiated a trade agreement with the United States in 2007 that was updated during Mr. Trump’s first term.
-
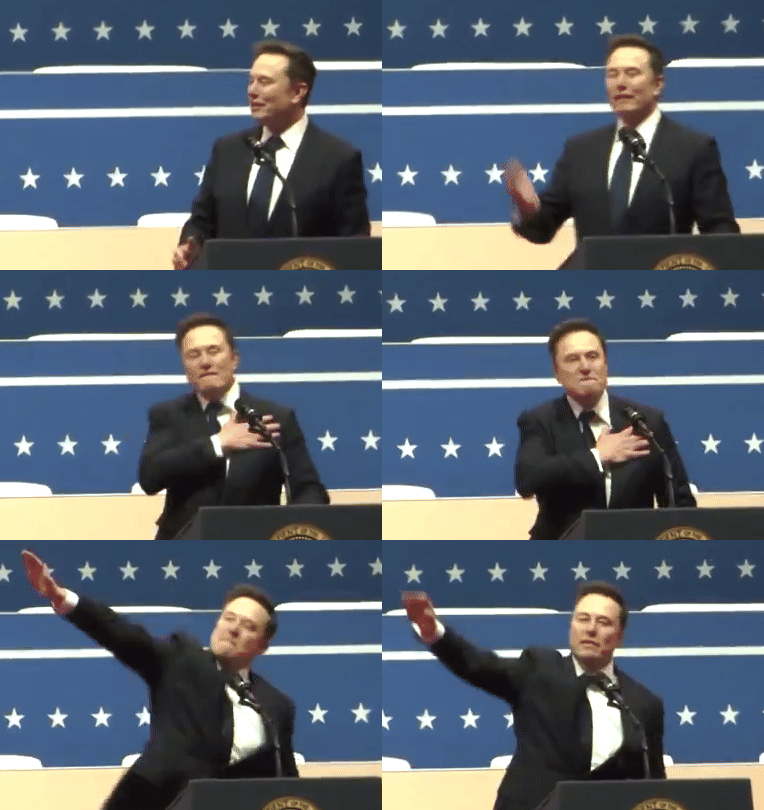
It's like an open invitation.
-

Elon Musk: Nazi traitor piece of shit [Confirmed]
bolverk replied to MaybeACoordinator's topic in Daily Texan
-
https://www.nytimes.com/2025/03/27/us/trump-dea-atf.html?smid=url-share The Trump administration is considering major changes in how the Justice Department operates, including by merging the Drug Enforcement Administration and the Bureau of Alcohol, Tobacco, Firearms and Explosives into one, according to an internal memo. The other changes include drastically altering how the department’s public integrity section functions; downsizing the fraud-focused investigations that involve foreign business practices and foreign influence efforts; and closing down the community relations office that works to quell public unrest after police shootings. The proposal, outlined in a memo issued by the deputy attorney general, Todd Blanche, and obtained by The New York Times, has yet to take effect. Officials are still seeking feedback from within the department before proceeding with what current and former Justice Department officials view as a significant reorganization. A spokesman for the Justice Department did not immediately comment on the memo. Overall, the Trump administration’s vision for the Justice Department, as outlined in the memo, is to downsize by consolidating some work inside its headquarters, while farming other responsibilities out to the U.S. attorney’s offices. The changes are described as part of the government’s efforts to downsize and streamline the federal work force, with help from the Elon Musk-led Department of Government Efficiency. The proposal to merge the D.E.A. and A.T.F. would almost certainly require congressional approval, though so far in the new administration, Congress appears to be playing a shrinking role in how the federal government is organized. Historically, lawmakers on the appropriations committees zealously guarded their authority over the organization of agencies like the Justice Department. It is unclear if the current leaders in Congress intend to assert such authority during the Trump administration. Administrations have long considered restructuring one or both of those two agencies, but no major reorganization has occurred since the post-Sept. 11 era, when the Department of Homeland Security was created and the A.T.F. was moved from the Treasury Department into the Justice Department. Under the plan, antitrust offices in Chicago and San Francisco would close, as would environmental offices in Denver, Seattle, San Francisco and Sacramento. Civil litigation offices in New York, Chicago, Raleigh and San Francisco would also be closed, according to the memo. The plan also calls for reassigning tax division lawyers to U.S. attorney offices around the country, and consolidating the department’s various legal divisions, including for national security, criminal prosecutions and other matters, into one single office. In the memo to Justice Department employees, Mr. Blanche asked for feedback on the plans by April 2.
-
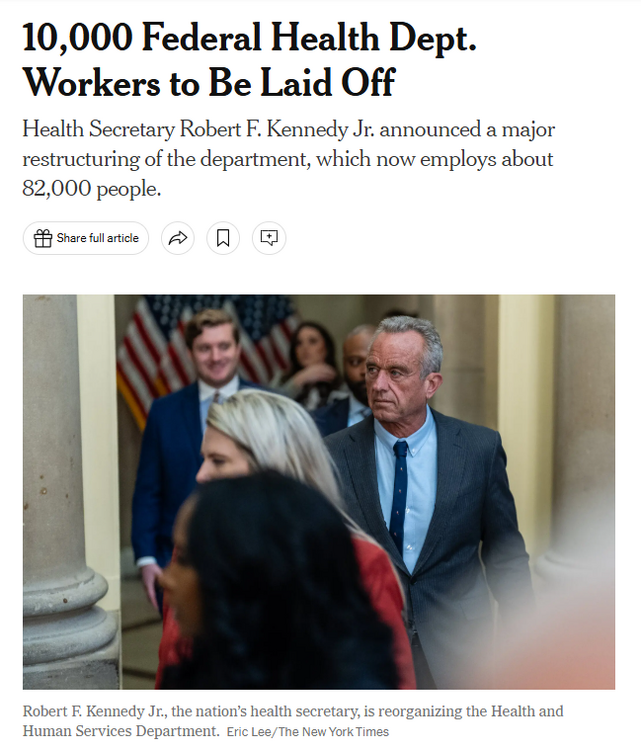
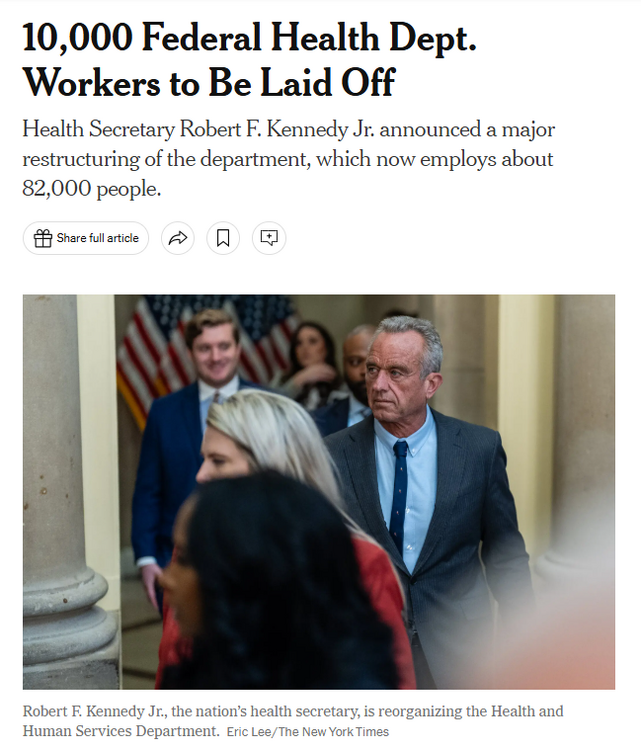
Decimating the public health system will surely be an effective strategy for combatting bird flu, measles, fentanyl addiction, and the myriad maladies causing illness in Americans. Make food poisoning great again! The FDA & CDC are expected to lose roughly 20 percent of their staff from the latest cuts alone. CDC will lose about 2,400 employees with cuts to its mission FDA will see 3,500 jobs cut National Institutes of Health will lose 1,200 staff The agency that administers Medicare and Medicaid is expected to lose 300 https://www.nytimes.com/2025/03/27/us/politics/health-department-job-layoffs-rfk-jr.html
-
-

Tracking Trump Administration and Cabinet picks
bolverk replied to PenelopeWitherspoon's topic in Cloak Room
I have no doubt. Still, I'm happy to see Elise get dumped after all her public knobslobbing.
Football ... Basketball ... Baseball ... Other Sports ... Futbol ... 🤫995🤫 ... Gambling ... Movies & TV ... Music ... Hobbies ... Lulz ... Food & Travel ... Daily Texan ... Business and Markets ... Cloak Room ... Help ... For Sale ... Board Discussion ... Subscribe!... Donate!... Advertise... COOKIE MONSTER!


